
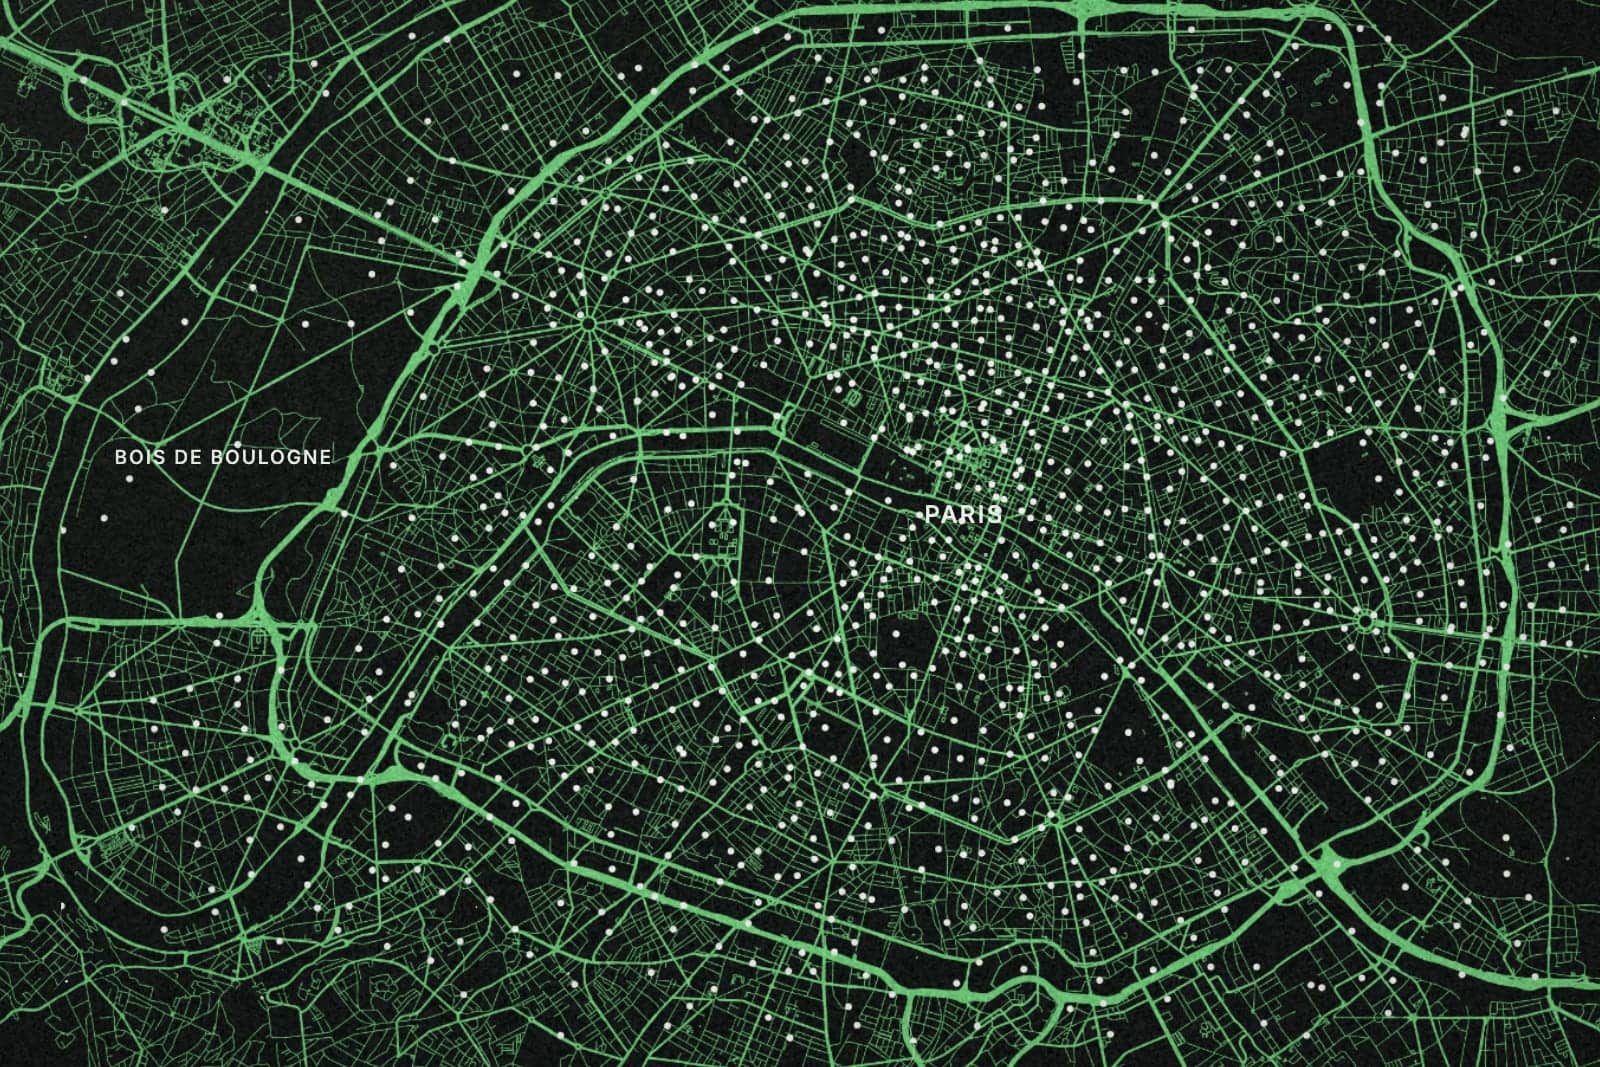
The aim of this piece is two-fold: (1) to provide you with a glimpse into the unbearable Parisian on-road conduct and (2) to show you how open bike data can be exploited to code some cool, yet as some would argue, useless stuff.
In retrospect, Vélib - a self-service bicycle system, is among chapters that mark my early days in Paris when all was still very much electrifying and « I was young and not gloomy ». Abandoned without reason, it swiftly fell into oblivion. Yet, with both gyms and swimming pools shut down until further notice due to the pandemic, new means of staying fit had to be found.
For Paris driving is a THING. A whole new can of worms has been opened up once on a road again in spite of my mental preparation thanks to countless encounters as a passerby. Every man for himself results in a perpetual hustle, the form of a sort of organized chaos of people moving in their own random ways, with a rare few who bothered to open le code de la route at least once. From pedestrians behaving as a flock of lost lambs and egocentric, if not daltonian, cyclists engaged in an ultimate battle with themselves to never stop to the ones behind motor vehicles who all together reject any existence of zebra crossings without traffic lights. The worst of the worst are only perhaps those on scooters, skateboards or any other I-do-not-give-a-crap mean of transport. No, it is not my Baltic side demanding a minimum of order for the sake of efficiency. It is a basic concept of optimizing the movement of flows.
On a positive note and despite my inner rage, it pushed me to use open data to write a code with python that extracts real-time information on Vélib stations and plots it on a map. Yes, I decided to reinvent the wheel in case you wonder. Or a bicycle as Lithuanians would say, sans mauvais jeux de mots.
Let’s get straight to the point shall we.
DATA
Data on Parisian bicycle scheme can be found:
https://www.velib-metropole.fr/donnees-open-data-gbfs-du-service-velib-metropole
For Lithuanian folks, but not exclusively, check the link below:
https://developer.jcdecaux.com/#/home
THE SCRIPT
Alongside with pandas, requests and json, the main library to import is folium which allows to visualize data on a map. Data can be requested with a couple of lines of code:
information_url = "https://velib-metropole-opendata.smoove.pro/opendata/Velib_Metropole/station_information.json"
status_url = "https://velib-metropole-opendata.smoove.pro/opendata/Velib_Metropole/station_status.json"

# Request static station data: caractéristiques et localisation des stations Vélib

r_1 = requests.get(information_url)
data_static = r_1.json()

# Request dynamic station data: le nombre de vélos et de bornettes disponibles par station

r_2 = requests.get(status_url)
data_dynamic = r_2.json()
Nested values have to be extracted from JSON using json_extract function so that a dataframe containing both static - Vélib stations names and coordinates - and dynamic - # of bikes and docks available - data could be put together. Data can be then plotted on a map using folium:
# Plot & style Paris map

paris_map = folium.Map(location=[48.856614, 2.3522219],
                        zoom_start=12, tiles="Stamen Toner")

LocateControl().add_to(paris_map)

locations_stations = hidalgo_df[["lat", "lon"]]
locations_list = locations_stations.values.tolist()

marker_cluster = MarkerCluster(icon_create_function = icon_create_function).add_to(paris_map)

for point in range(0, len(locations_list)):
    folium.Marker(
            location=locations_list[point],
            popup=folium.Popup((
                    "<strong>" + "Station: " + "</strong>" +
                    str(velib_df["name"][point]) + "<br>" +
                    "<br>" + "<strong>" + "Mechanical Bikes Available: " +
                    "</strong>" + str(hidalgo_df["mechanical"][point]) + "<br>" +
                    "<br>" + "<strong>" + "Ebikes Available: " + "</strong>" +
                    str(hidalgo_df["ebike"][point]) + "<br>" +
                    "<br>" + "<strong>" + "Docks Available: " + "</strong>" +
                    str(hidalgo_df["num_docks_available"][point])), max_width=180),
                    icon=folium.Icon(color="red",icon="bicycle", icon_color="white", prefix="fa"
                    )).add_to(marker_cluster)

paris_map